
Content
.png)
Step-by-step guide to integrating Microsoft Clarity in Webflow
Learn how to integrate Microsoft Clarity with Webflow for tracking key user interactions, heatmaps, session recordings, and optimizing site performance.

our CRO services
Features + Benefits
Understand user behavior with visual insights
Microsoft Clarity’s heatmaps and session recordings let you see exactly how users navigate your Webflow site. This visual data helps you identify popular areas, spot navigation issues, and understand what keeps visitors engaged.
Identify friction points for a smoother experience
Using Clarity’s data, you can track where users drop off or struggle with specific actions, like completing forms or navigating pages. These insights allow you to tweak designs and layout for a smoother user journey.
Focus on key metrics that impact conversions
With filters and segmenting options, Clarity allows you to drill down on important behaviors like device type, traffic source, and user journey. This targeted data can guide design decisions that enhance conversions and engagement.
If you are planning to integrate and properly set up Microsoft Clarity into your Webflow project, you're in the right place. In this guide, we'll walk you through exactly how to set up Clarity, so you can start tracking user behavior like heatmaps, session recordings, and more.
We’ll cover everything from adding the Clarity app to creating a dashboard, ensuring that you get the right actionable data from your website.
Ready? Let’s get started.
What is Microsoft Clarity and why use it with Webflow?
Microsoft Clarity is a free tool that helps you track user interactions on your website through features like heatmaps and session recordings. For Webflow users, Clarity offers valuable insights that can be used to optimize design, improve user experience, and fine-tune site performance—all without affecting Webflow’s seamless design capabilities.
Now, that you understand what Microsoft Clarity is, let’s see how you can integrate it into your Webflow project.
Integrating Microsoft Clarity with Webflow
Adding Microsoft Clarity to your Webflow project is fairly straightforward. Here’s how you can do it -
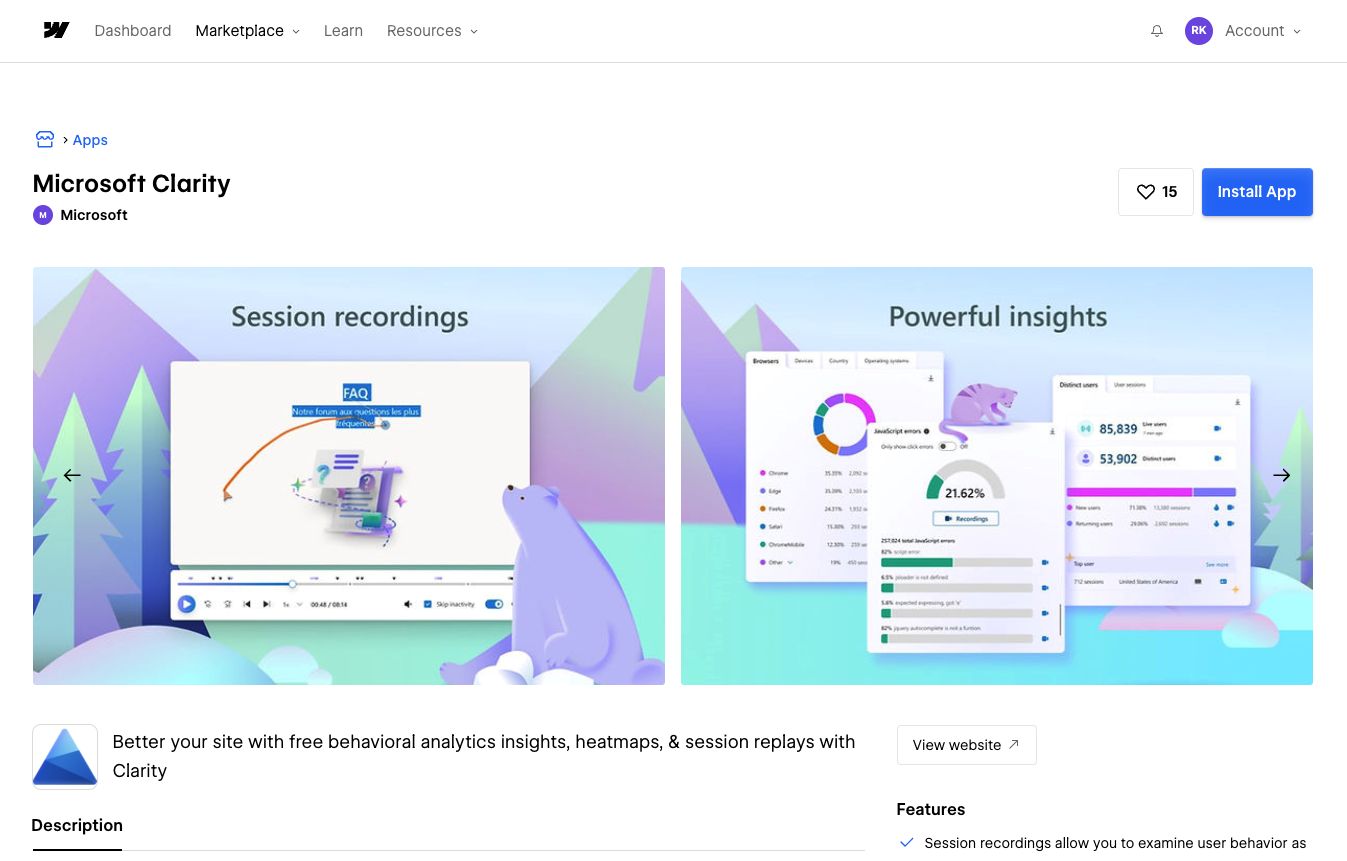
1. Install the Microsoft Clarity App from Webflow’s App Marketplace
- Go to the Webflow App Marketplace.
- Search for Microsoft Clarity and click on the app.
- Click Install App and authorize the integration.
2. Connect Your Webflow Project to Microsoft Clarity
- After installing the app, log into your Microsoft Clarity account or sign up if you don't already have one.
- Once signed in, you’ll be prompted to connect your Webflow site.
- Select the Webflow project you want to track from the list of available sites.
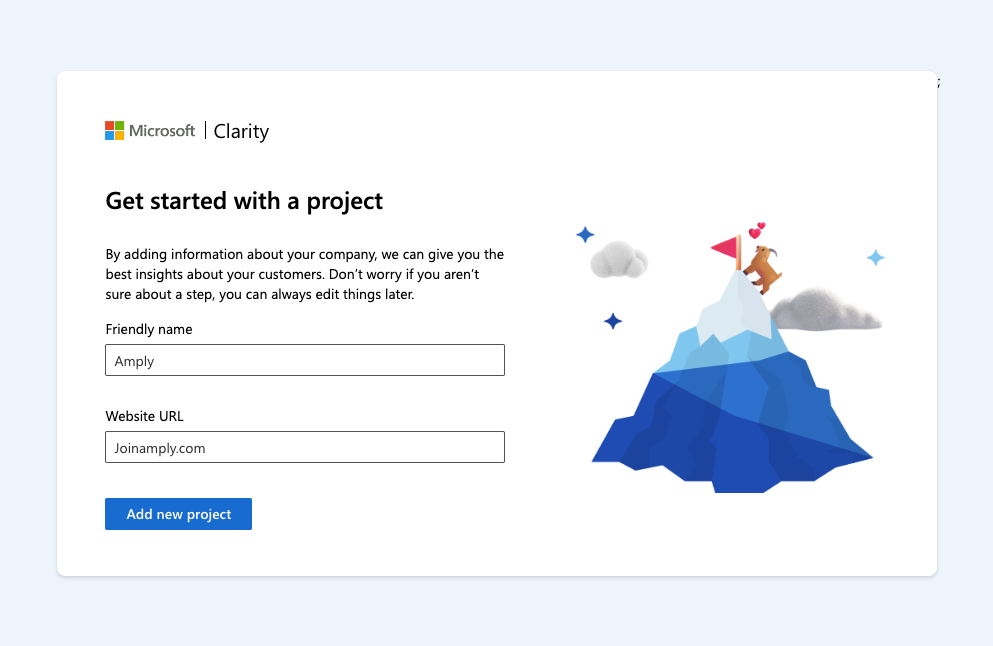
3. Set Up Your Clarity Project
- In Clarity, create a new project for your Webflow site by entering your site name and confirming the URL.
- Clarity will automatically be integrated with your Webflow project via the app—no need to manually add tracking codes.
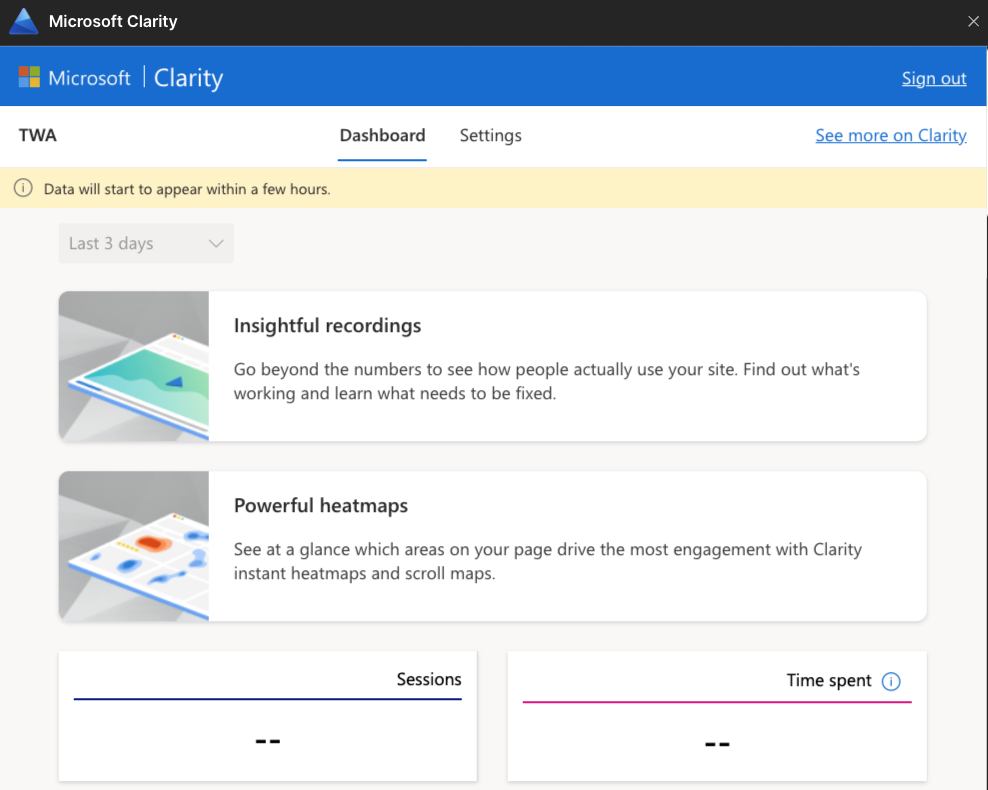
4. Verify the Integration
- Go back to your Microsoft Clarity Dashboard.
- Click on your project and wait for Clarity to verify the connection. This process can take a few minutes.
- Once verified, Clarity will begin tracking user data, including heatmaps and session recordings.
- You can also open Microsoft Clarity from Webflow Apps from Apps (Press E) panel in Webflow, and see this data.
5. Explore the Data
- Once the integration is active, explore insights like heatmaps, session recordings, and user journeys directly from the Clarity Dashboard.
- Allow some time for your visitors' data to populate before reviewing.
Advanced Features and Customization in Microsoft Clarity for Webflow
Now that your basic integration is done, it’s time to take it to the next level with more advanced features and customization. Here’s how you can leverage Clarity’s full potential for your Webflow project:
1. Setting Up Smart Events in Microsoft Clarity
Smart Events in Clarity allows you to track specific user interactions, such as button clicks or page visits, without the need for custom coding. Here’s how to set them up:
a. Go to the smart events section
- In your Clarity Dashboard, click the Smart Events option in the sidebar.
- This will take you to a screen where you can create and manage Smart Events.
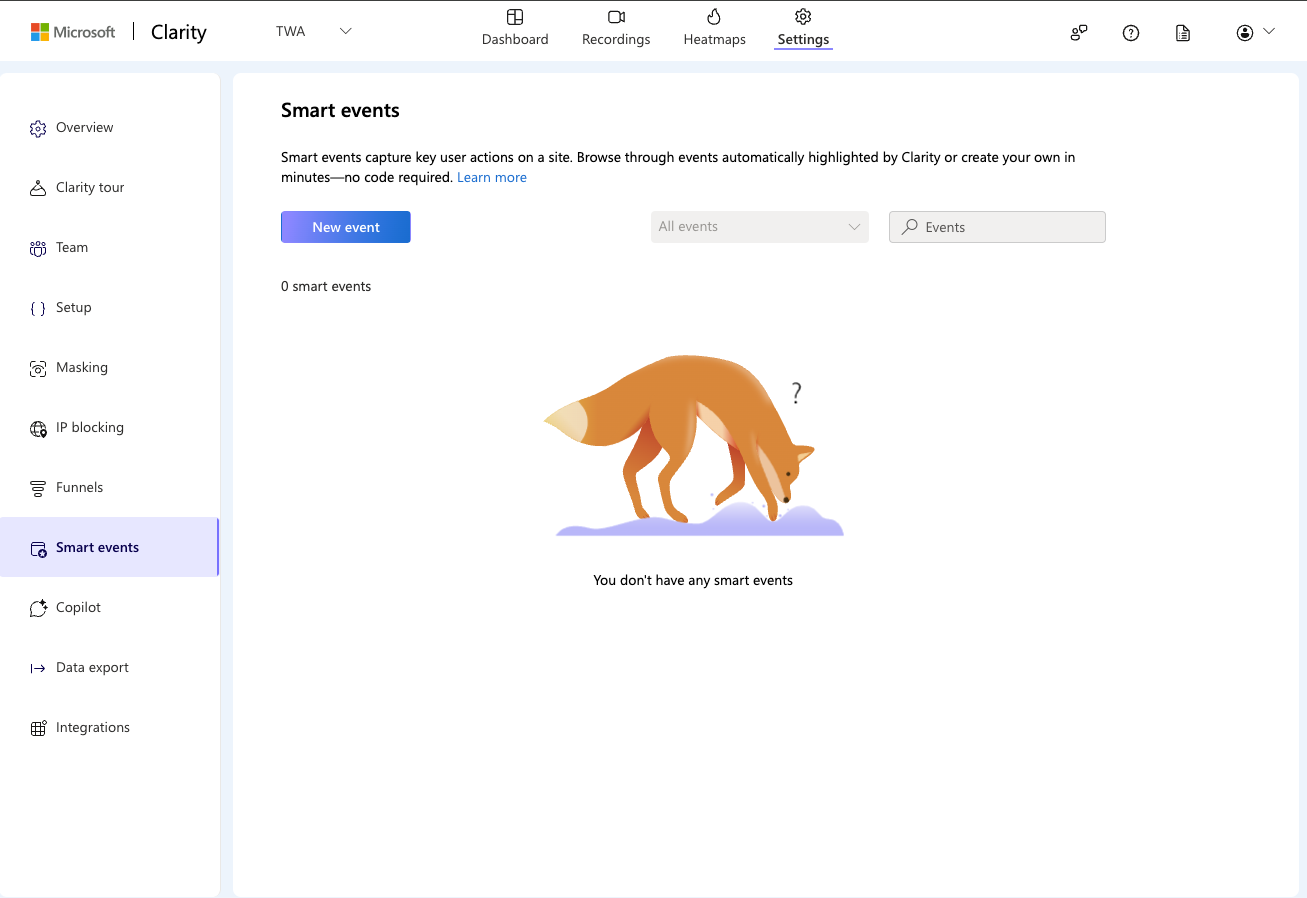
b. Click on 'New Event'
You’ll see a button that says New Event. Click it to start creating a new Smart Event.
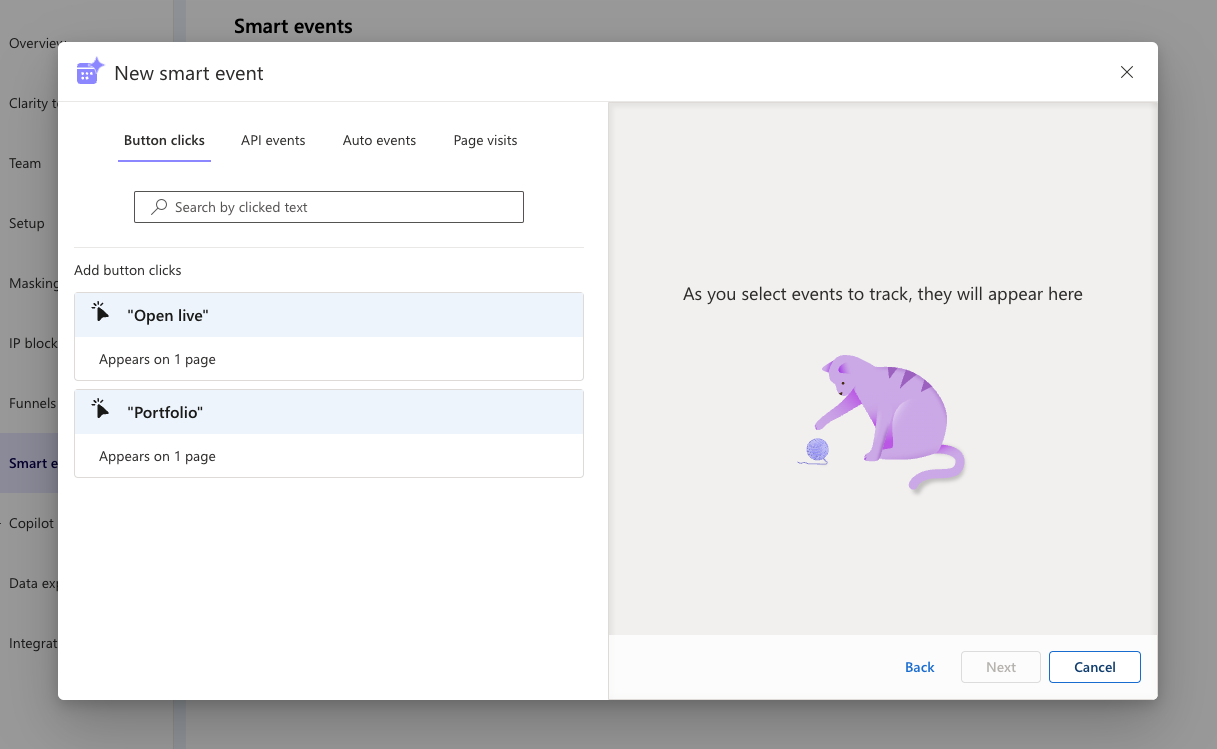
c. Select the type of event to track
You’ll be presented with several options for event types:
- Button Clicks: Track when users click specific buttons on your Webflow site. For example, you might track clicks on a “Sign Up” or “Buy Now” button.
- API Events: Track events triggered through an API, which may be useful for more complex, custom setups.
- Auto Events: Let Clarity automatically detect important user interactions, such as rage clicks or dead clicks.
- Page Visits: Track when users visit specific pages on your site.
d. Configure the event
Let’s say you want to track button click as a smart event. Here’s how you can do that -
- Choose the Button Clicks tab.
- Clarity will automatically detect buttons on your site, and you can select which ones to track (e.g., “Get in touch”, “Open live,” “Portfolio”).
- Simply click on the button you want to track and it will be added to your Smart Event list.
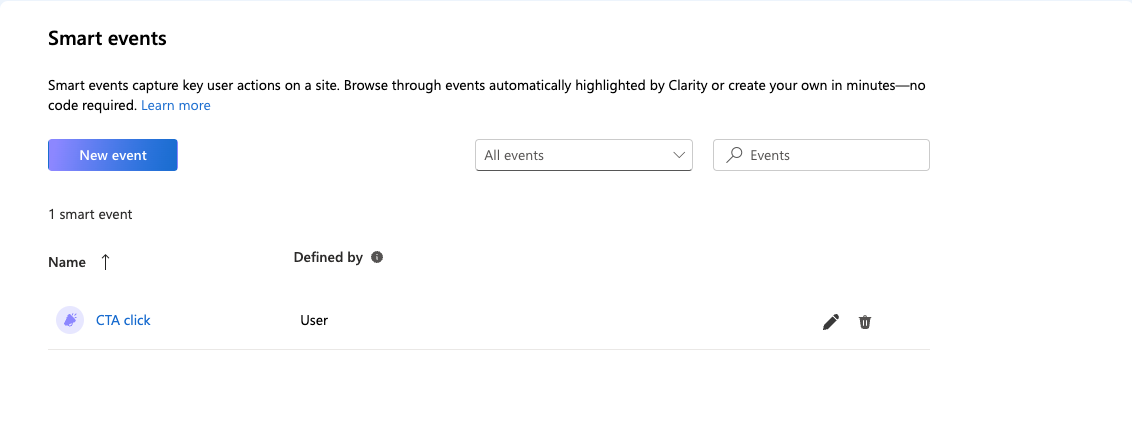
- Once you’ve configured your event, click Next and name your smart event.
- Click Save to finalize your Smart Event.
- Your event will now start tracking and show up in your Clarity Dashboard.
e. Monitor event data and taking action
Once your Smart Events are live, you’ll start collecting valuable user data in your Clarity dashboard. Here’s how you can use that data to improve your website:
- If users frequently click a button but don’t complete the action (e.g., form submission or purchase), consider revisiting the user flow or page layout to remove friction points.
- Use heatmaps to see if key buttons or CTAs are being clicked. If they aren’t, try changing their position or design to make them more prominent.
2. Filtering and Segmenting Your Data
Clarity allows you to filter and segment your user data to focus on specific interactions or user groups. This is especially useful for targeting key audience behaviors.
- Device and browser filtering: Use filters to track how mobile users interact with your Webflow site vs. desktop users. You can also filter data by browser type to spot cross-browser issues.
- Source Filtering: Segment users by traffic source (e.g., social media vs. organic search) to understand how different audiences behave on your site.
- Bounce and Exit Segments: Create segments to track users who bounce after visiting one page or exit after navigating a few pages. Use this to optimize content or identify points where users lose interest.
3. Using Heatmaps and Recordings to Improve UX
If your website gets a lot of mobile traffic, use Clarity’s heatmaps and session recordings to understand how users behave on mobile devices:
- Are they missing key buttons or CTAs because they’re too small?
- Are mobile-specific interactions, like touch gestures, working as intended?
By customizing your mobile layout based on Clarity’s insights, you can provide a better user experience on smaller screens.
4. Syncing Clarity Data with Other Tools
If you're using other analytics tools alongside Clarity (like Google Analytics or Hotjar), you can easily combine data to get a more comprehensive view:
- Integrate with Google Analytics: Compare Clarity’s session recordings and heatmaps with data from Google Analytics, such as bounce rates, traffic sources, and conversion metrics.
.png)
- Combine with Hotjar: If you’re using Hotjar for user feedback and surveys, syncing that data with Clarity’s heatmaps and session recordings provides a fuller picture of user behavior.
5. Sharing Insights with Your Team
If you’re collaborating with others (e.g., designers, developers, or marketers), Clarity makes it easy to share data:
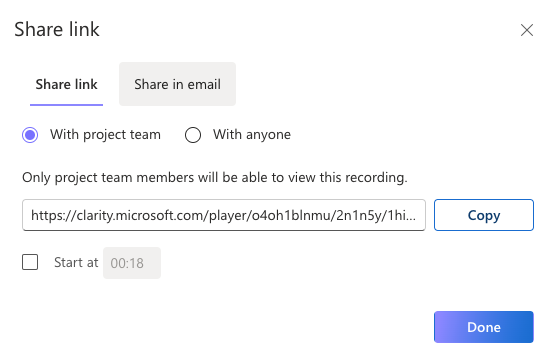
- Share Session Recordings: Send session recordings directly to your team so they can see exactly how users are interacting with certain elements of your Webflow site.
- Tag Important Sessions: Use tags to mark sessions that need attention, such as where users encountered issues or abandoned the site.
Optimizing the Microsoft Clarity Dashboard for your Webflow Projects
Once you’ve integrated Microsoft Clarity with your Webflow project, the key to getting the most out of it lies in optimizing your Clarity dashboard to your needs. By customizing your dashboard to focus on relevant user behaviors and site metrics, you’ll be able to make informed design and UX decisions faster and more efficiently. Here's how you can optimize your Clarity dashboard for Webflow projects:
1. Organizing the Dashboard for Actionable Insights
- Prioritize Key Metrics: While Clarity tracks a wide range of behaviors (e.g., heatmaps, session recordings, click data), not all metrics will be relevant to every Webflow project. Focus your dashboard on the interactions that align with your goals.
- For an e-commerce site, prioritize metrics around product clicks, add-to-cart events, and checkout flow.
- For portfolios or content-based sites, emphasize scroll depth, time spent on pages, and navigation between CMS collection items (e.g., blog posts, case studies).
- Customize the Layout: In Clarity, you can filter and sort data to show the most important metrics on your dashboard. Set up your dashboard with the most critical data visible at a glance.
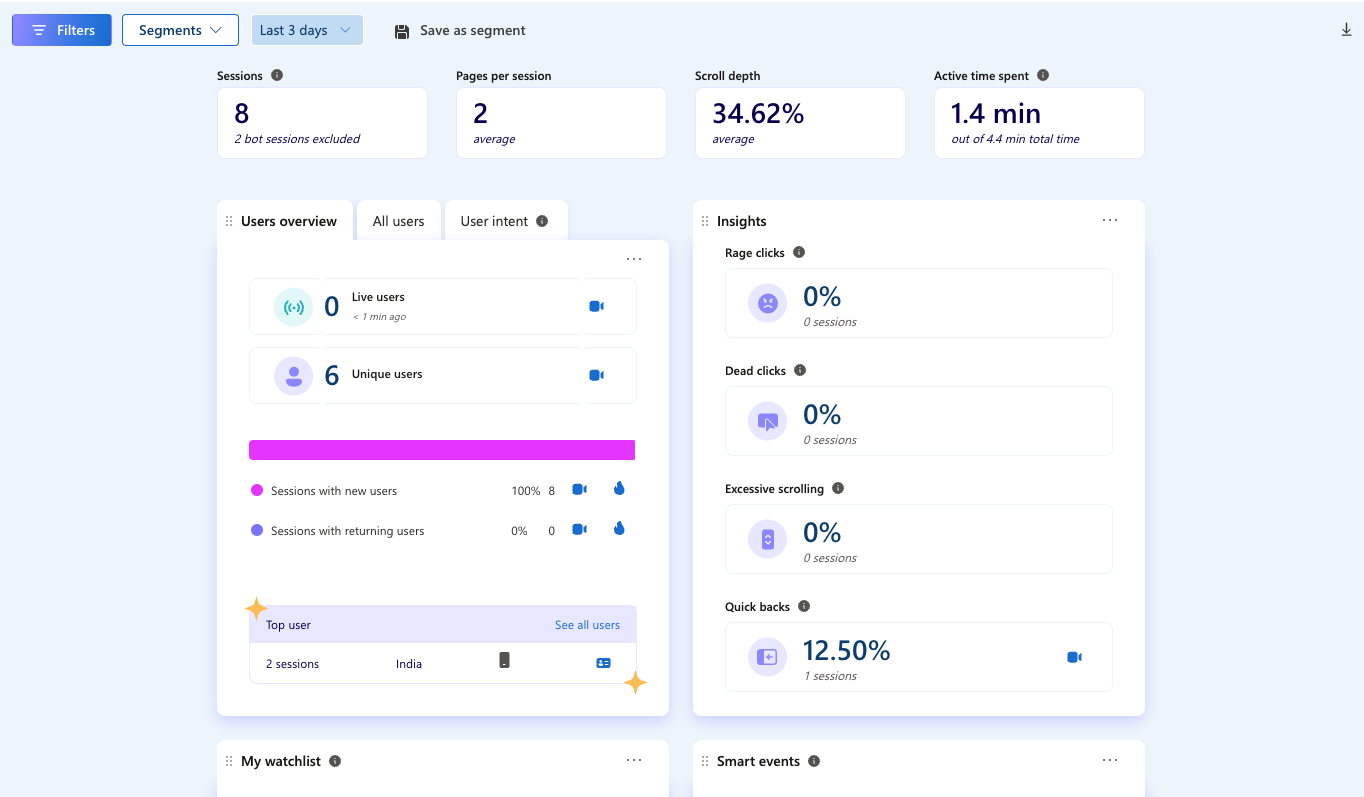
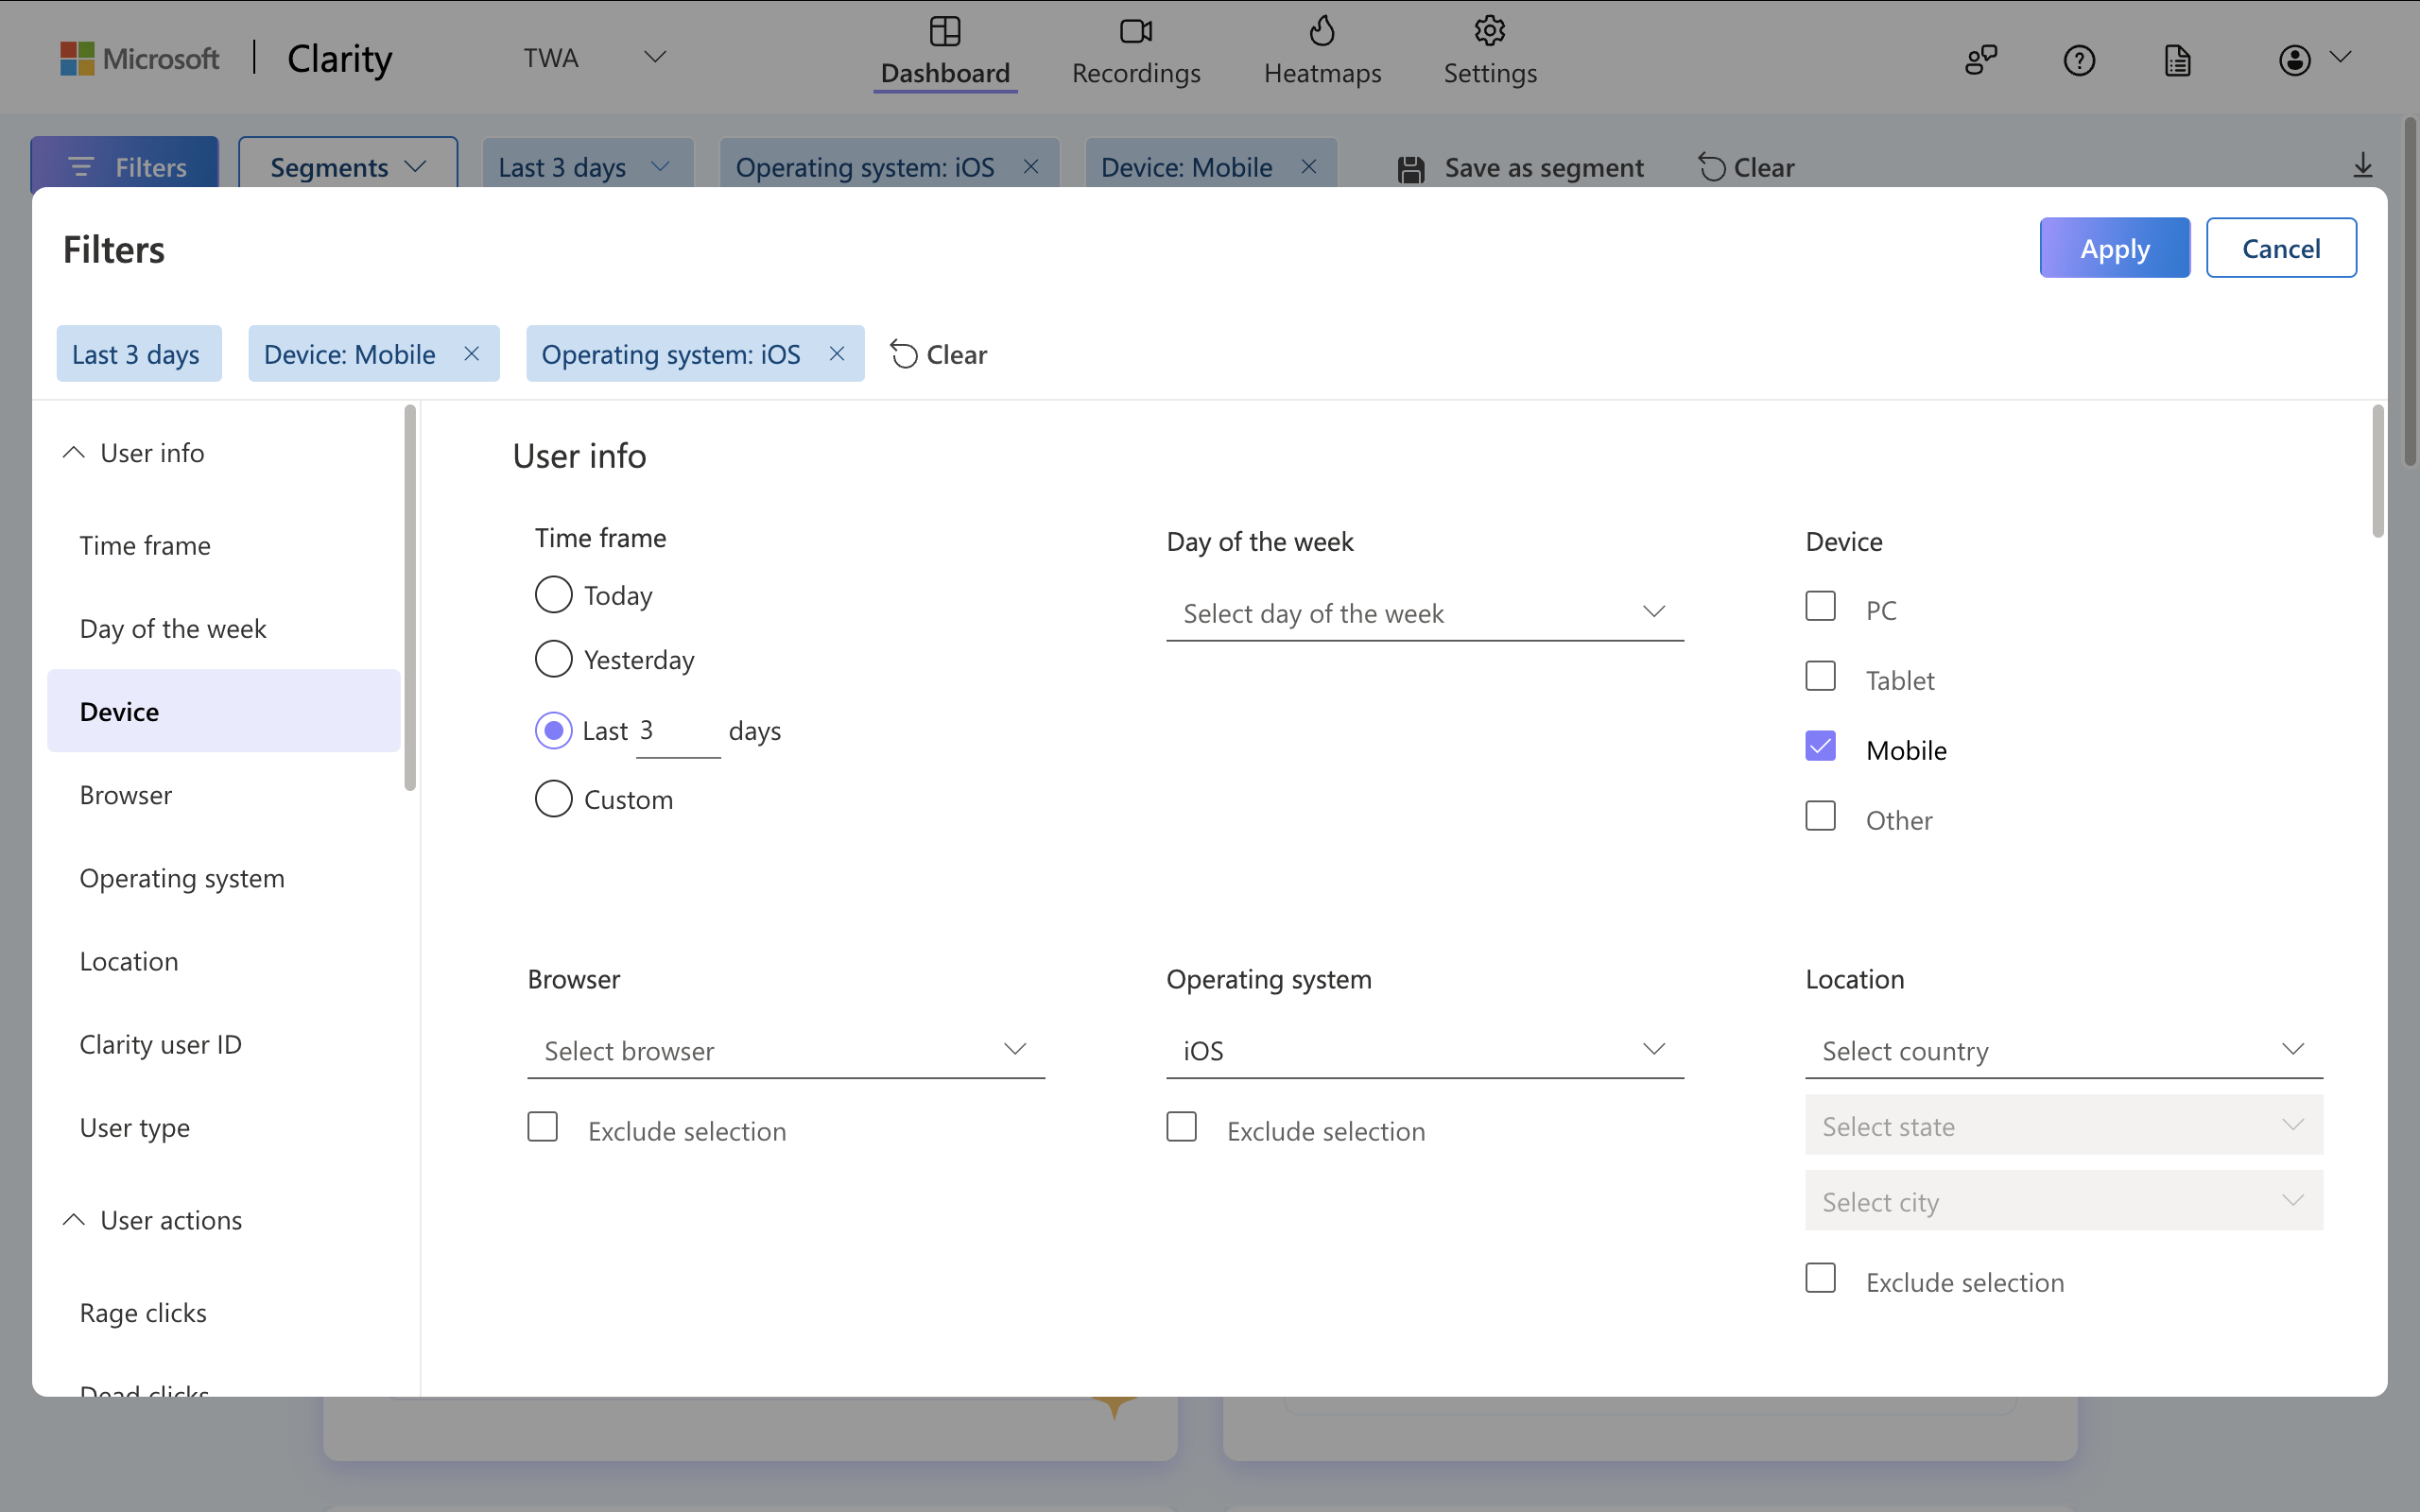
2. Using Filters to Narrow Down Data
Filtering helps you focus on specific user groups and behaviors. Clarity provides a range of filters you can apply to understand different segments of your visitors.
- Device and Browser Filtering:
- Use the Device Type filter to see how your Webflow site performs on desktop vs. mobile. Mobile users often interact differently, and you might find that certain features aren’t as effective on smaller screens.
- Use Browser Filters to track how different browsers handle your Webflow interactions. This can help identify any cross-browser issues.
- Source Filtering:
- If your traffic comes from multiple channels (e.g., social media, organic search, paid ads), the Source Filter helps you see how users from different sources engage with your Webflow site.
- Use this data to optimize your site for the highest-converting channels.
3. Setting Up Segments for Specific User Actions
Segments in Clarity let you group users based on specific interactions or behaviors, allowing you to dive deeper into how different audiences engage with your Webflow project.
- Segmenting by Behavior: Create segments to track users who clicked on key CTAs, scrolled through specific sections, or interacted with particular elements of your website (e.g., buttons, form submissions).
- Bounce and Exit Segments: Identify users who left your site after only visiting one page (bounce) or who dropped off after navigating a few pages. This is especially useful for understanding if certain design elements or content are causing visitors to leave early.
- Custom Event Segments: If you’ve set up custom events (like tracking clicks on CMS items or product purchases), create segments to focus specifically on these users. This allows you to understand the user flow from interaction to conversion.
4. Analyzing Heatmap and Session Recording Data for Key Pages
Some Webflow projects will have key pages where user behavior is crucial to track—like landing pages, pricing pages, or product pages. Here’s how to optimize your analysis:
- Focus on High-Traffic Pages: Use heatmaps and session recordings on your most-visited pages to ensure users are interacting with critical elements, such as buttons, links, and forms.
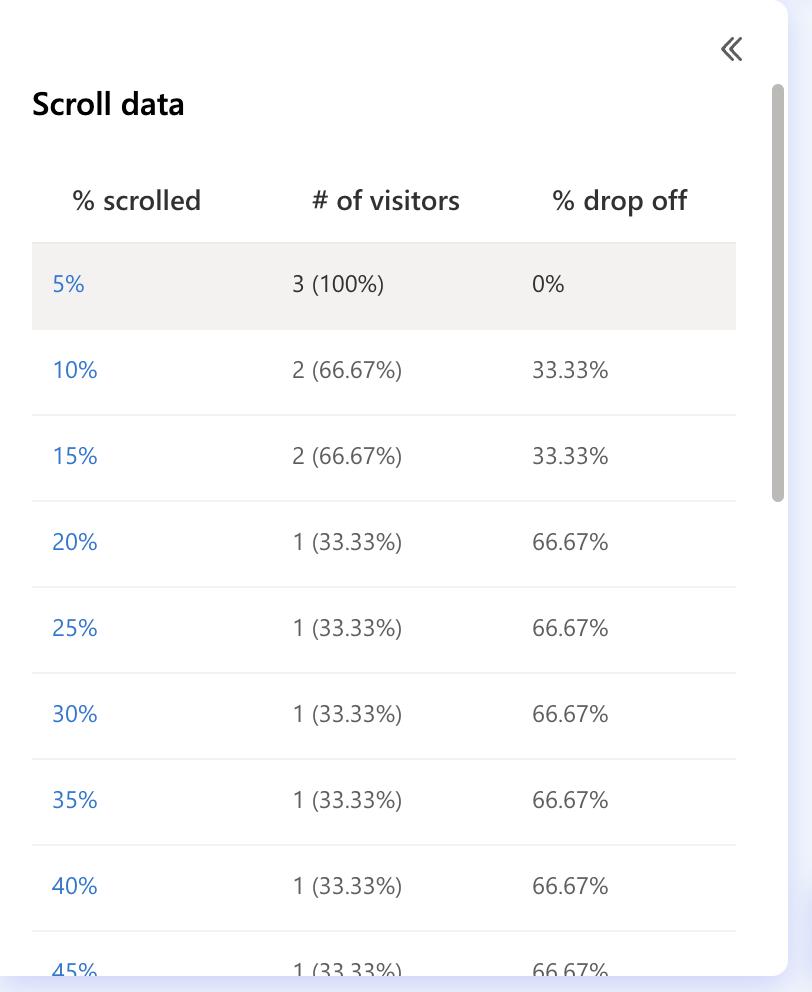
- Identify Scroll Depth Issues: For longer pages (like a blog or homepage), check the scroll heatmaps to see if users are missing important content because they aren’t scrolling far enough. If needed, adjust the layout or move important elements higher up.
5. Use Behavioral Insights to Drive Design Decisions
Once your dashboard is optimized, the insights you gather should directly influence your design choices. For example:
- Heatmap Analysis: If users are clicking on non-interactive areas of your page (e.g., images or text that aren’t linked), consider turning these elements into clickable items or CTAs to guide them toward conversion.
- Session Recordings: If you notice that users are struggling with a particular form or interaction, simplify the form fields or the interaction process to make it more intuitive.
6. Regular Dashboard Reviews
To ensure your Webflow site is continually optimized, review your Clarity dashboard on a regular basis. Look for changes in user behavior after implementing design or layout updates, and adjust your strategy as needed.
7. Ensuring GDPR and Privacy Compliance
When using Clarity on your Webflow site, it’s essential to comply with privacy laws like GDPR and CCPA. Here are the key steps you need to take to achieve this:
- Cookie Consent Banner: Ensure users give consent before Clarity tracks their behavior. You can use Webflow’s built-in tools or clonables like Finsweet’s cookie consent to implement a consent banner.
- Anonymize Data: Microsoft Clarity automatically anonymizes IP addresses, but ensure this feature is enabled to maintain compliance with GDPR.
Conclusion
By integrating Microsoft Clarity into your Webflow project, you can gain detailed insights into user behavior that directly inform design improvements and site performance. From tracking key interactions with heatmaps and session recordings to customizing your dashboard for actionable insights, Clarity helps you make data-driven decisions that enhance user experience.
With regular data reviews and goal tracking, you’ll be able to continually optimize your Webflow site based on real user behavior, ensuring your site remains responsive, engaging, and aligned with your business goals.
About The Author


Let's work together!
Schedule a call with us to start your brand's trip to the stars...or maybe just to talk shop 😉

Cade Biegel
Co-founder @ Amply

Luke Lewis
Co-founder @ Amply