
Content
Setting up Webflow Analyze on your website - everything you need to know
Learn how to set up Webflow Analyze, interpret your website's data, and use actionable insights to improve your site's performance.

our CRO services
Features + Benefits
Track Your Website’s Performance with Ease
Get a clear view of your site’s traffic, top-performing pages, and user behavior—all without leaving your Webflow dashboard.
Simplify Your Analytics Process
Skip the complicated third-party setups. Webflow Analyze integrates seamlessly, giving you actionable insights in one place.
Make Data-Driven Decisions Quickly
Identify what’s working, fix what’s not, and optimize your website based on real user data to boost engagement and conversions.
You’ve got visitors, clicks, and stats... but what’s next? Most analytics tools just dump a bunch of numbers on you and leave it at that. Webflow Analyze changes that, by helping you focus on what really matters.
It’s built right into your Webflow dashboard, so there’s no extra hassle setting it up. Whether you want to see which pages are working, where people drop off, or how visitors navigate your site, it gives you the tools to understand it all.
In this guide, we’ll cover everything you need to know to get started with Webflow Analyze. From setting it up to understanding your data, we’ve got you covered.
Ready? Let’s get started!
What is Webflow Analyze?
First, let’s understand what the tool is, and what you can do with it. Webflow Analyze is an analytics tool built directly into Webflow. Think of it as a quick and easy way to track key metrics, like how much traffic your site gets, which pages perform best, and how visitors interact with your content.
What makes Webflow Analyze stand out is how easy it is to use. You don’t need to mess with third-party tools or complicated setups. It’s all seamless, giving you a clear picture of what’s working and what might need attention. Whether you’re a designer, marketer, or just someone managing your site, it’s a tool that makes website analytics a lot less intimidating.
With Webflow Analyze, you can:
- Get a clear view of your website’s overall traffic.
- See which pages are engaging visitors and which might need a tweak.
- Monitor user behavior to understand how people navigate your site.
Now that you understand what Webflow Analytics is, and how it can help you, let’s see how you can set it up and start understanding your data.
Setting Up Webflow Analyze on Your Website
- Log into Your Webflow Account
Log in to your Webflow account and select the website you want to analyze.
- Navigate to the 'Insights' Tab
Once inside your project dashboard, look for the Insights tab(or press Option + I). This is where all analytics data will live.
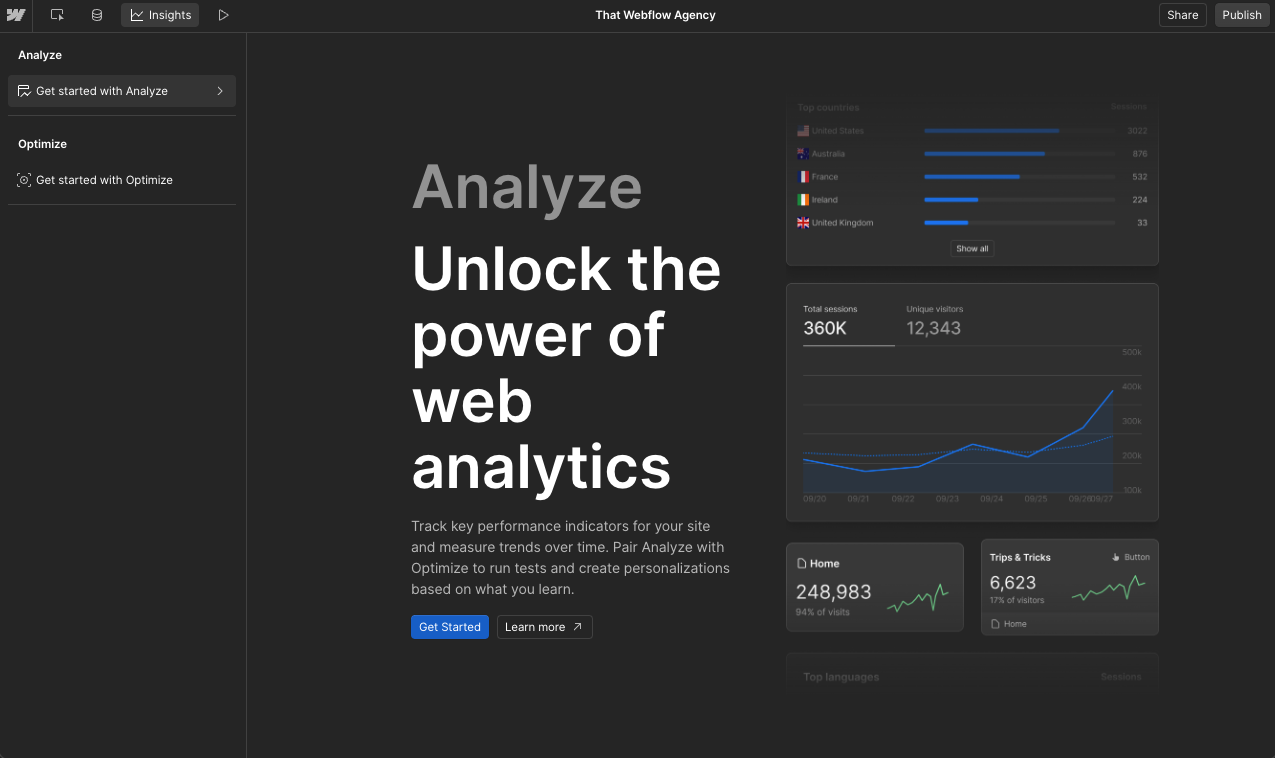
- Enable Analyze
Once inside, you’ll see an option to ‘get started’. Once clicked, you’ll be redirected to your site plan settings. Choose the plan based on your expected monthly traffic, and make the payment to activate Webflow Analyze.
.png)
- Customize Your View
Once you’ve activated Webflow Analyze, you’ll start to see data populate on your analyze dashboard. Configure any settings you want to adjust, like the date range for your data or specific metrics you want to focus on. Webflow Analyze will automatically start gathering insights for you to review.
- Verify the Setup
To ensure everything is working correctly, visit your site and interact with a few pages. Then, head back to the Insights tab to confirm that data is being recorded.
Interpreting Your Analytics Data
Now that your Webflow Analyze is setup and capturing data, let’s understand what it means. Understanding these insights can help you improve your website and better serve your audience. Here’s how to break it down:
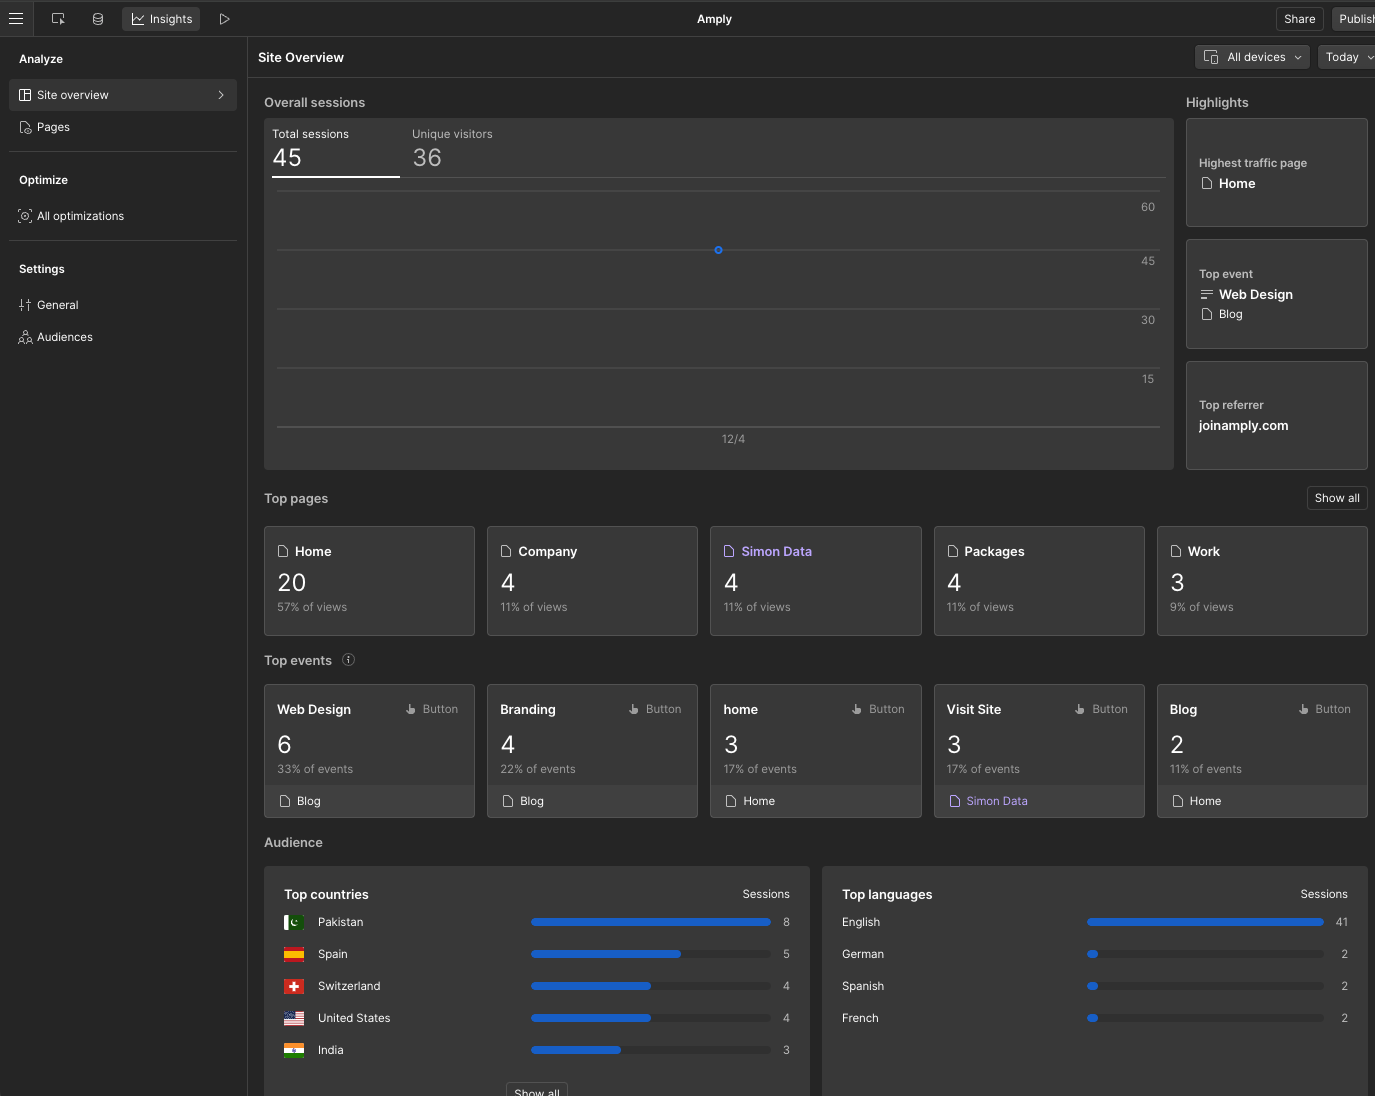
Site Overview
In the Insights panel under Analyze, the Site overview gives you a snapshot of your website’s performance. Here’s what to look for:
- Overall Sessions: See how many visitors are coming to your site over a specific period. This helps you understand trends and measure the impact of your marketing efforts.
- Top Pages: Identify which pages are getting the most traffic and engagement. This shows what content resonates with your audience and where to focus your efforts.
- Top Events: Find out which actions—like button clicks or form submissions—are most common. This insight helps you understand user behavior and optimize your site’s functionality.
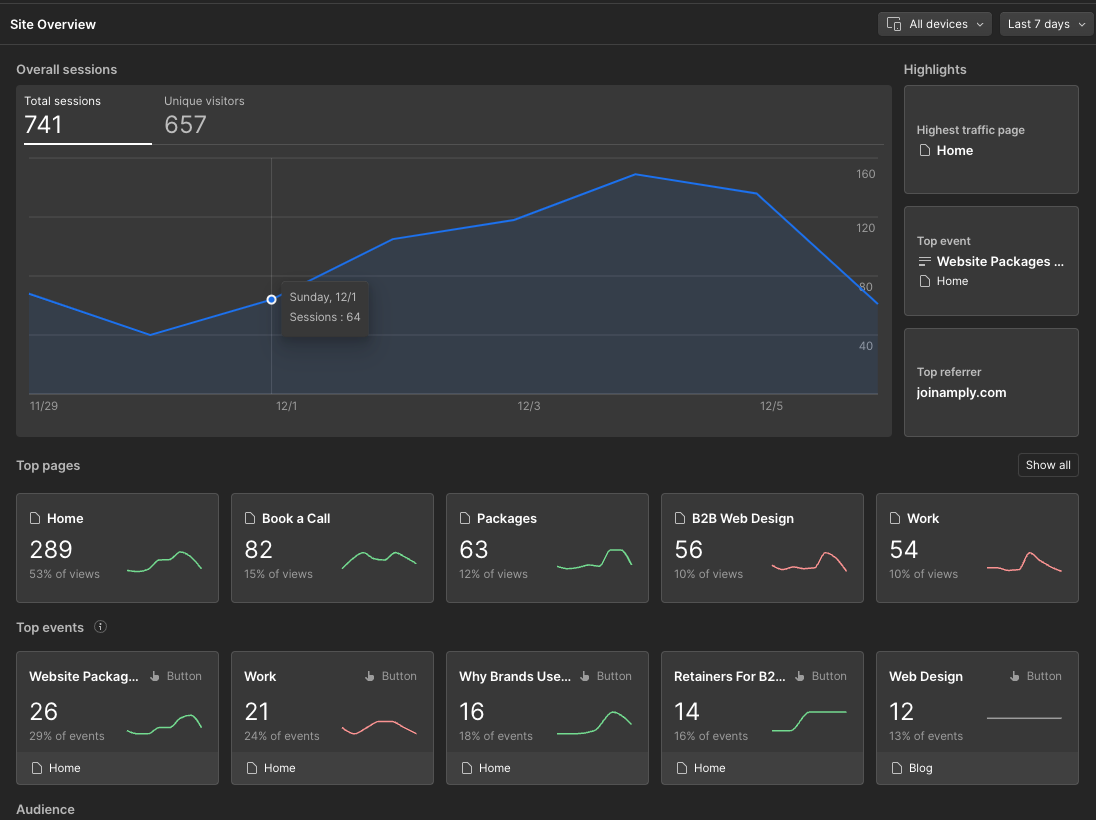
By default, the site overview shows data from the last 7 days, but you can adjust the date range and filter by device type to get more specific insights.
Page Insights
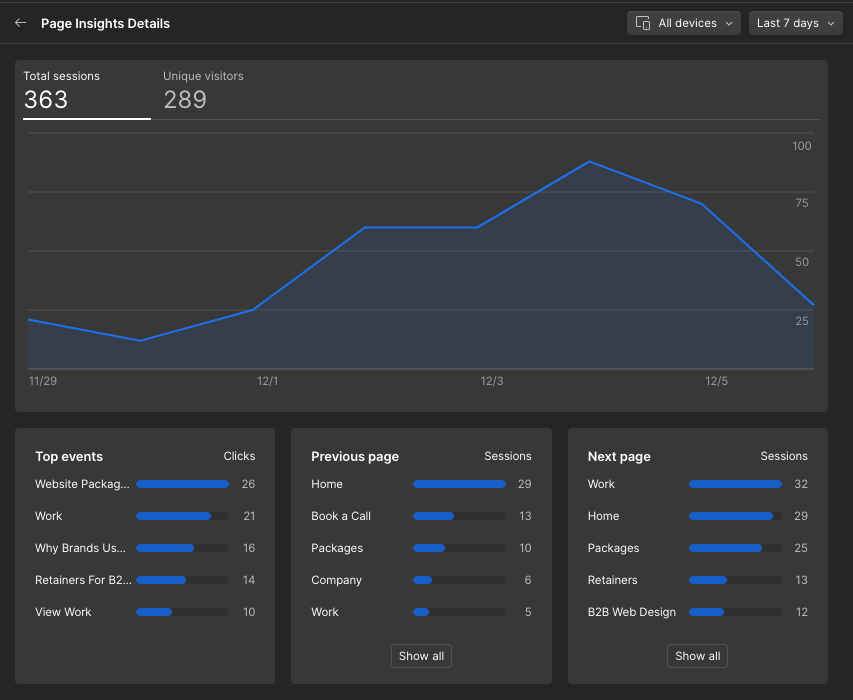
To dive deeper into individual page performance, go to Insights > Analyze > Pages, and select a page. Here’s what you’ll find:
- Page Views and Unique Visitors: See how many times a page was viewed and how many distinct visitors it had. This helps you gauge a page’s popularity and reach.
- Traffic by Device and Language: Understand which devices (like mobile or desktop) and languages your visitors use. This information is crucial for optimizing user experience across different platforms and audiences.
- Navigation Paths:
- Previous Pages: Discover the top pages visitors were on before arriving at the current page.
- Next Pages: See the top pages visitors go to after leaving the current page.
- These insights reveal how users navigate your site, helping you identify popular paths and potential drop-off points.
- Top Events: Learn about the most common interactions on the page, such as clicks on specific buttons or links. This data shows how engaging your content is and where improvements can be made.
By clicking on a page, you can view all its related analytics data in context, making it easier to understand performance and user behavior.
Making Data-Driven Decisions
With these insights, you can:
- Identify Strengths and Weaknesses: See which content performs well and which areas need improvement.
- Optimize User Experience: Adjust your site’s design and content based on how visitors interact with it.
- Track Progress: Monitor changes over time to see if your adjustments lead to better engagement and performance.
Best Practices for Using Webflow Analyze
Now that you know how to set up and interpret your data, let’s talk about getting the most out of Webflow Analyze. Following these best practices will help you use the tool effectively and turn insights into action.
1. Check Your Analytics Regularly
Consistency is key. Make it a habit to review your analytics at least once a week. This helps you spot trends, identify anomalies, and respond to changes in real-time. For instance:
- Traffic spikes could indicate a successful campaign.
- Sudden drops might signal technical issues or a need for content adjustments.
2. Set Clear Goals
Decide what success looks like for your website. Whether it’s increasing traffic, boosting conversions, or improving user engagement, having specific goals helps you focus on the metrics that matter. For example:
- Track form submissions if lead generation is your priority.
- Monitor top-performing pages to see what drives the most traffic.
3. Optimize Your High-Traffic Pages
Use Webflow Analyze to identify your most visited pages and make them even better. Focus on:
- Improving load times.
- Refining content to match user intent.
- Adding CTAs (Call-to-Actions) to guide visitors toward your goals.
4. Address Drop-Off Points
Navigation insights are gold when it comes to understanding user behavior. If visitors frequently leave a specific page:
- Check for issues like slow loading, unclear CTAs, or irrelevant content.
- Experiment with layout or copy changes to keep users engaged.
5. Use Device and Language Insights
Webflow Analyze lets you filter data by device and language. This is crucial for creating a better experience for your audience:
- Ensure your website is mobile-friendly if most visitors come from mobile devices.
- Tailor content or design for regions with high traffic.
6. Leverage Event Tracking
Top events show how users interact with your site, such as clicking buttons or filling out forms. Use this data to:
- Identify what’s working (e.g., a popular CTA).
- Test different elements to improve engagement (e.g., button placement or text).
7. Compare Data Over Time
Trends are often more valuable than single data points. Use Webflow Analyze’s date range filters to:
- Compare performance before and after a website update.
- Measure the impact of campaigns or changes to your content strategy
Conclusion
Understanding your website’s performance doesn’t have to be complicated. Webflow Analyze simplifies the process, giving you the data you need to make informed decisions—all from your Webflow dashboard. Whether it’s tracking your traffic, identifying your top-performing pages, or figuring out where users drop off, it’s a tool that helps you focus on what really matters.
By following the steps in this guide, you’ll be able to set up Webflow Analyze, interpret your data, and use best practices to turn insights into action. The next step? go through your website analytics, experiment with changes, and watch your website improve over time.
Feeling stuck or unsure where to start? We’re here to help! Whether it’s building your new website, setting up Webflow Analyze, or optimizing your website, Amply can help.
Get in touch—we’d love to help you make the website of your dreams a reality.
FAQs
1. What is Webflow Analyze?
Webflow Analyze is a built-in analytics tool in Webflow that helps you track your website’s performance. It provides insights into traffic, top-performing pages, and visitor behavior—all directly accessible from your Webflow dashboard.
2. How do I set up Webflow Analyze?
To set up Webflow Analyze, log in to your Webflow dashboard, navigate to the Insights tab, and enable the Analyze feature. From there, you can start tracking key metrics like page views and visitor interactions.
3. Is Webflow Analyze free?
Webflow Analyze is included with Webflow’s paid hosting plans. If you’re on a free plan, you’ll need to upgrade to access this feature.
4. Can I use Webflow Analyze with other analytics tools?
Yes, you can use Webflow Analyze alongside tools like Google Analytics. While Webflow Analyze offers simple, integrated insights, third-party tools can provide deeper analysis and more advanced features.
5. What data can I track with Webflow Analyze?
With Webflow Analyze, you can track:
- Overall traffic to your website.
- Page views and unique visitors.
- Top-performing pages.
- Visitor navigation paths.
- User interactions (e.g., clicks and form submissions).
6. Does Webflow Analyze track real-time data?
Webflow Analyze updates your analytics regularly, but it does not provide real-time tracking. If you need real-time insights, consider pairing it with a tool like Google Analytics.
7. How is Webflow Analyze different from Google Analytics?
Webflow Analyze is built for simplicity and ease of use, focusing on key website metrics without overwhelming you with data. Google Analytics, on the other hand, offers more advanced features like audience demographics, multi-channel attribution, and detailed user segmentation.
8. Can Webflow Analyze track user behavior on individual pages?
Yes, Webflow Analyze provides insights into individual page performance, including page views, navigation paths, and user interactions. This helps you understand how visitors engage with specific pages on your site.
9. How can Webflow Analyze help improve my website?
Webflow Analyze gives you actionable insights into your site’s performance. By identifying your best and worst-performing pages, understanding navigation paths, and monitoring user interactions, you can make informed changes to improve user experience and engagement.
10. Does Webflow Analyze comply with privacy laws like GDPR?
Yes, Webflow Analyze is designed with privacy in mind. Since it’s integrated directly into Webflow, you have more control over how data is collected and stored, making it easier to comply with privacy regulations like GDPR and CCPA.
About The Author


Let's work together!
Schedule a call with us to start your brand's trip to the stars...or maybe just to talk shop 😉

Cade Biegel
Co-founder @ Amply

Luke Lewis
Co-founder @ Amply