Your website looks great. The design is on point, the content is engaging—but for some reason, conversions are still low. What gives?
You’re not alone. Many website owners and marketers face the same frustration. Guessing what might work, changing a headline or tweaking a button isn’t enough. You need data to back up your decisions. That’s where A/B testing and Webflow Optimize comes in.
With Webflow Optimize, you can stop relying on hunches and start using real user insights to improve your website. Whether you want more clicks, sign-ups, or sales, this guide will show you exactly how to get started.
By the end of this blog, you’ll know how to set up your first test, understand your test data, and turn your website into a 24/7 sales machine.
Ready? Let’s begin
Understanding CRO
Before we start with A/B testing, let’s zoom out a bit, and understand the whole point of doing this. What you are essentially doing with A/B testing, tweaking content, images and placements, is optimising your website so that more people take the action you intended them to take, i.e. Conversion Rate Optimization.
CRO is the process of improving your website to get more visitors to take a specific action—whether it’s making a purchase, signing up, or just exploring more pages. Instead of simply driving more traffic to your site, CRO focuses on making the most of the traffic you already have.
How Does CRO Work?
There are a few tools and techniques you can use for CRO -
- A/B Testing: Comparing two versions of a headline, CTA, image or webpage to see which performs better.
- Heatmaps: Identifying where visitors click and where they lose interest.
- User Feedback: Learning directly from your audience about what’s working and what isn’t.
A/B testing, in particular, is one of the most popular and effective methods for CRO. It allows you to make data-backed changes to your site, ensuring you’re always moving in the right direction.
What is A/B Testing?
Now that you understand what CRO is, let’s see what A/B testing is and how you can use it to improve your website's conversions.
A/B testing is a method that lets your audience tell you what they prefer. Think of it as a simple experiment. You take a page on your website, make one small change, and show the two versions—Version A (original) and Version B (variation)—to different groups of visitors. By tracking how they interact, you can see which version gets better results.
Why A/B testing works:
- It’s data-driven: No more “I think this might work” guesses. You’ll have real numbers backing up your choices.
- It’s cost-effective: Instead of redesigning your whole site, you can make small tweaks that have a big impact.
- It’s user-focused: Your audience’s behavior tells you what they prefer.
Key Components of A/B Testing:
- Control (A): This is your original version, the one you’re currently using.
- Variation (B): This is the new version with a change—like a new headline, color, or image.
- Metrics: These are the performance indicators you’re measuring, such as click-through rates, form submissions, or purchases.
- Statistical Significance: Ensures that the results you see aren’t just random but truly reflect user preferences.
With A/B testing, you’re not just designing a website—you’re designing an experience that resonates with your audience. And the best part? Tools like Webflow Optimize make it easy to run these tests, even if you’re just starting out.
Introduction to Webflow Optimize
So, you’ve got the basics of A/B testing down, but where does Webflow Optimize fit in?
Webflow Optimize is a powerful, built-in tool designed to make A/B testing as simple as possible for Webflow users. Think of it as your testing assistant, helping you experiment with different ideas and find out what really works—all without needing to write a single line of code.
Why Webflow Optimize?
Unlike other A/B testing tools that can feel overwhelming, Webflow Optimize is made specifically for Webflow users. It integrates seamlessly with your projects, meaning you don’t have to juggle multiple platforms or deal with complicated setups.
Here’s what makes it worth using:
- No-Code Testing: You can set up and manage A/B tests directly in the Webflow Designer. No coding or external tools required.
- AI-Powered Insights: Webflow Optimize uses AI to help you identify patterns and optimize your pages faster.
- Audience Targeting & Personalization: Go beyond A/B testing by tailoring content for specific user groups—like mobile visitors, visitors from certain regions, or returning users. Personalization allows you to deliver a more relevant experience that increases engagement and conversions.
- Real-Time Results: See how your variations perform in real-time, so you can act quickly on what’s working.
What Can You Test with Webflow Optimize?
The possibilities are endless! Here are some ideas to get you started:
- Headlines: Does “Sign Up Today” convert better than “Join Us Now”?
- Buttons: Will changing the color or text of your call-to-action button drive more clicks?
- Images: Do product photos or lifestyle shots resonate more with your audience?
And pretty much any other element in your website.
Now that you are familiar with Webflow Optimize, let’s see how you can set it up in your Webflow website.
Setting Up Webflow Optimize
Getting started with Webflow Optimize is straightforward. Here’s how you can enable it:
Step 1: Access Project Settings
- Log into Webflow and select the project you want to optimize.
- Click on the Settings icon for that project to enter the Project Settings dashboard.
Step 2: Enable Webflow Optimize
- In the Project Settings, navigate to the Plans tab, then click on Add ons.
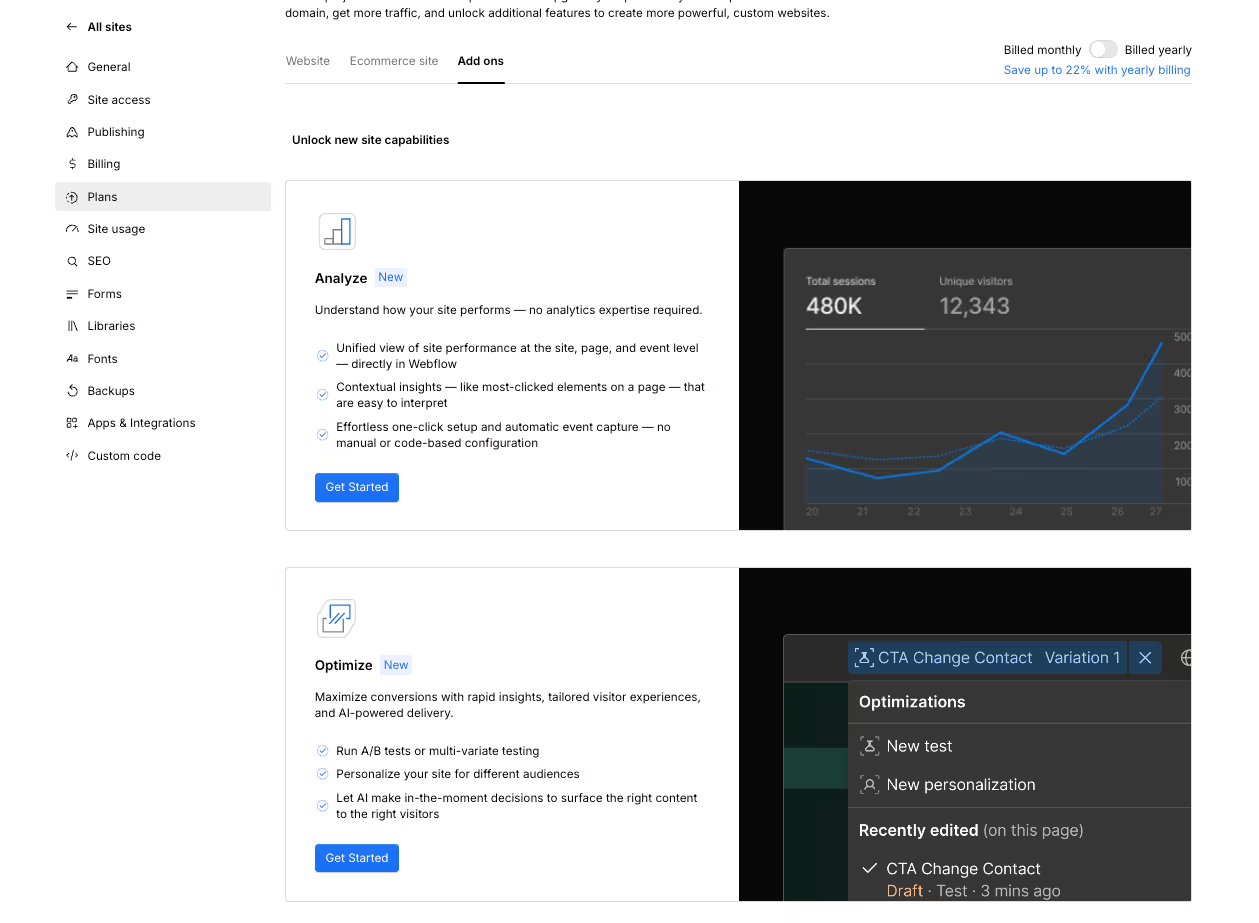
- Scroll down to find the Webflow Optimize section.
- Click the ‘Get Started’ button and you’ll be asked to confirm payment for enabling Webflow Optimize. Once done, you would have successfully enabled Webflow Optimize on your website.
Step 3: Verify the setup
Once you’ve completed the setup, head to inisghts panel in your designer, and you should start to see settings for Webflow Optimize as well. You can manage your optimizations and view results here as well.
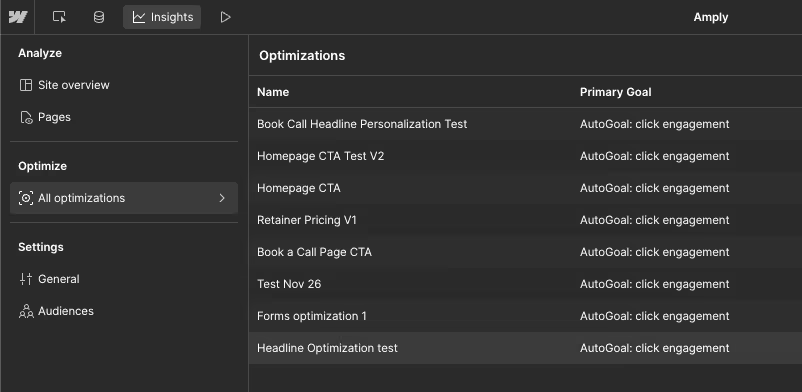
Creating Your First A/B Test With Webflow Optimize
The setup is complete, now comes the interesting part. Let’s set our first A/B test together and
Step 1: Identify What to Test
Before jumping into the setup, decide on the element or feature you want to optimize. For beginners, start with high-impact changes like:
- Headlines: Does “Upgrade Your Workflow Instantly” work better than “Streamline Your Processes with Ease”?
- Call-to-Actions: Will “Start Your Free Trial Today” outperform “Explore All Features Now”?
- Images: Do screenshots of your software interface convert better than an image of a happy team using your product?
Keep it simple by testing one element at a time for clear results. For this example, we will test 2 variations of headlines in our first test.
Step 2: Creating Your First Test
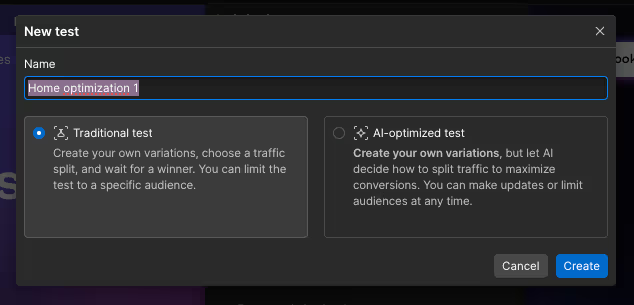
- To create your new test, click on the ‘optimizations’ icon at the top center of your designer, then click on ‘New Test’.

- Name your test, and choose if you want to manually decide the traffic split between variations (traditional test), or let AI decide it for you(AI-Optimized test), and click ‘create’. For this example, we’ll pick a traditional test.
- Your base variation will be the page you have so far, and variation 1 becomes the new version where you will make the changes.
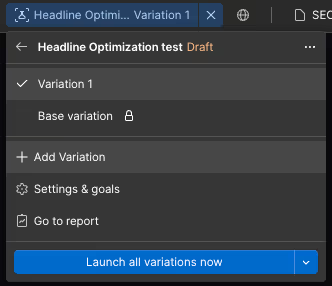
- You can make all the changes you want, and it will only affect this variation while your base variation remains safe.
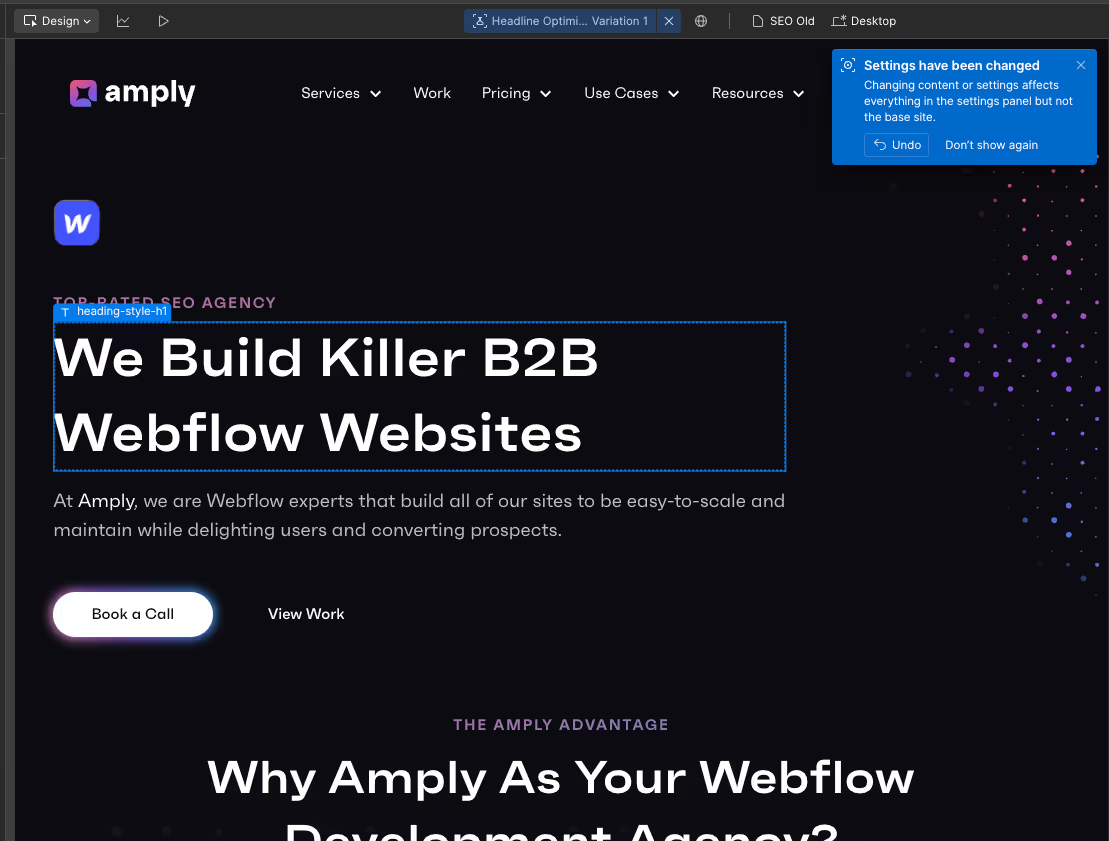
- Once you are happy with this variation, you can choose to create more variations or go to the next step ‘Settings and Goals.
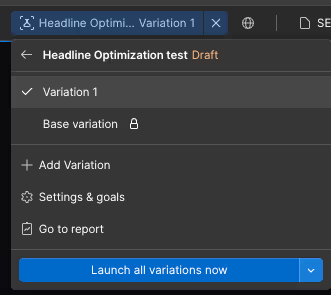
Step 3: Setting Goals and Audiences for Your Tests
On ‘Settings & Goals’ you can decide if everyone sees your test or only a specific group. You can also decide how the traffic is distributed between these 2 variations. For this example, we will keep the recommended options.
Webflow also generates an ‘Autogoal’ for your test that tracks how your visitors are interacting with your site. But you can also integrate tools like Hubspot or Marketo to track form submissions and other metrics you may need.
.avif)
Once you are happy with your settings, hit ‘launch all variations now’ and you’ll be asked to publish your site. Once published, your A/B test will start running.
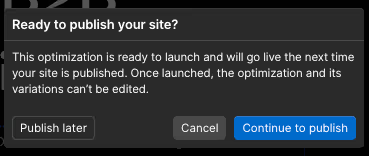
Congrats! You’ve successfully set up your first A/B test with Webflow Optimize.
Analyzing Results
Once your test has been running for a while, you’ll start to see data appear on your Insight panel.
To see your optimization results, Go to your insights panel > Click ‘All Optimizations’ > select the test you want to see results for.

Here’s what to do once you are in -
Step 1: Check Conversion Rate and Strength
.avif)
Start by looking at the Conversion Rate and Strength metrics to see which variation performed better:
- Conversion Rate: This shows the percentage of visitors who completed your desired action, like signing up or clicking a button. A higher conversion rate means the variation is doing its job well.
- Strength: For AI-optimized tests, this metric indicates how likely it is that the variation will keep outperforming the others. Higher strength values mean more consistent performance.
What to Do: Use these metrics to identify which variation is the front-runner in achieving your test goal.
Step 2: Review Performance Over Time
.avif)
Next, look at how each variation performed throughout the test:
- The Performance Chart shows the conversion rates for all variations across the test period.
- Check for trends—did a variation perform consistently well, or did its performance change over time?
Why This Matters: This helps you spot patterns. For example, if one variation’s performance dipped mid-test, it might indicate an external factor (like a campaign launch or seasonal change) impacted results.
Step 3: Explore Audience Insights
.avif)
Audience insights help you understand how different groups of visitors interacted with your variations:
- Traffic Source: See where your visitors came from—organic search, paid ads, social media, etc.
- Device Type: Check how variations performed on desktops, tablets, or mobile devices.
- Visitor Type: Compare results for new vs. returning visitors.
What This Means: These insights can reveal surprising details, like a variation performing better with mobile users or visitors from a specific channel. Use this data to refine future strategies.
Step 4: Look at Traffic Allocation Over Time
.avif)
The Traffic Allocation Chart shows how Webflow divided your visitors among the variations over the course of the test:
- In traditional tests, traffic is usually split evenly unless you manually change the split.
- In AI-optimized tests, Webflow might adjust the traffic based on which variation starts performing better.
Why This Is Important: This ensures each variation got enough traffic for fair results, and it also highlights how AI optimization dynamically adapts to what’s working.
By reviewing these key areas, you’ll get a clear picture of how your variations performed and why. Use these insights to make data-driven decisions and confidently apply the winning changes to your website. This brings us to the final step of our A/B test process - implementing the insights we gained.
Implementing Insights
Once you’ve analyzed your test results and identified a clear winner, it’s time to apply those insights to your website. Here’s how to do it -
Step 1: Implement the Winning Variation
- Open the Webflow Designer and apply the changes from the winning variation to your live site.
- If you’ve been testing multiple elements, ensure that only the changes from the winning variation are updated.
- Double-check how the updated page looks and functions across all devices—desktop, tablet, and mobile.
Step 2: Monitor Post-Implementation Results
Even after implementing the winning changes, keep an eye on how your site performs:
- Watch key metrics, like conversion rates or bounce rates, to confirm that the improvements are sustained over time.
- Be alert for any unexpected shifts in user behavior—these could indicate new opportunities for optimization.
Pro Tip: External factors, like a campaign or a seasonal event, could impact performance. Make note of these when evaluating your results.
Step 3: Document Your Insights
Create a simple record of your A/B test. Include:
- What you tested (e.g., headline, button color).
- The results, including metrics like conversion rate improvements or audience segment performance.
- Lessons learned (e.g., “Bold CTAs performed better with mobile users”).
This documentation will help build a roadmap for future experiments, ensuring you don’t test the same thing twice and making it easier to optimize further.
Step 4: Plan Your Next Test
Optimization is an ongoing process. Use what you’ve learned from this test to guide your next steps:
- If your headline test worked well, try testing a subheadline or CTA next.
- Use audience insights (e.g., device or traffic source data) to inform new hypotheses.
Each test builds on the last, so keep experimenting to uncover more ways to improve your site.
Best Practices for A/B Testing with Webflow Optimize
To make the most of A/B testing, it’s important to approach it with strategy and focus. Here are 5 key best practices to guide you:
1. Test One Element at a Time: Focus on a single variable, like headlines, CTA buttons, or images, to identify what’s truly driving results. Testing too many changes at once can spoil the insights.
2. Define Clear Goals: Start every test with a specific objective, such as increasing sign-ups or reducing bounce rates. Use measurable metrics like click-through rates (CTR) or conversion rates to evaluate success.
3. Run Tests Long Enough: Allow your tests to run until you’ve collected enough data to reach statistical significance. Ending tests too early can lead to unreliable conclusions.
4. Document Your Results: Keep track of what you tested, why you tested it, and the outcomes. This creates a knowledge base for future experiments and helps you build a data-driven optimization strategy.
5. Iterate and Keep Testing: Optimization is never finished. Use each test as a stepping stone, applying what you’ve learned to improve other elements of your site.
By sticking to these practices, you’ll maximize the value of A/B testing and create a website that continuously improves based on real user insights.
Conclusion
A/B testing with Webflow Optimize isn’t just about improving a single webpage—it’s about creating a better, more engaging experience for your audience. By focusing on data-driven decisions, testing one element at a time, and iterating based on results, you’re setting your website up for long-term success.
The process might seem overwhelming at first, but with tools like Webflow Optimize, even beginners can run impactful tests without coding. And remember, optimization is an ongoing journey. Every test you run brings you one step closer to understanding your audience and meeting their needs.
You can learn more about Webflow Optimize in their Optimize course. And if you need help improving your website, Book a call with us, and our team here at Amply can help you up your website game.
FAQs
1. How long should I run an A/B test?
It depends on your website traffic and the type of test. Generally, tests should run for at least two weeks or until you reach statistical significance. Webflow Optimize provides tools to help you calculate this.
2. What if my A/B test has no clear winner?
A "no result" outcome is still valuable! It indicates that the tested change didn’t impact your audience significantly. You can revisit your hypothesis and try testing a different element.
3. Do I need coding knowledge to use Webflow Optimize?
No coding is required. Webflow Optimize is a no-code tool integrated into Webflow. Its user-friendly interface is designed for beginners and professionals alike.
5. How much traffic do I need to conduct an A/B test?
The more traffic, the better! For small websites, it may take longer to gather enough data. Tools like Webflow Optimize can help you calculate the sample size needed for statistical significance.
6. Can I A/B test multiple changes at once?
Technically, yes, but it’s not recommended for beginners. Testing one change at a time ensures you can identify the exact factor influencing results.
7. How do I know what to test?
Start with high-impact elements like headlines, call-to-action buttons, or images. Look for pages with high traffic but low conversions for the best opportunities.
8. What metrics should I track during A/B testing?
Focus on metrics relevant to your goals, such as click-through rates (CTR), bounce rates, or conversion rates. Webflow Optimize offers analytics to track these.


.avif)
.avif)
.avif)


